

Edit: a previous version of this article claimed that un-doing the trade effects had large effects on manufacturing employment. The reality is likely to be more nuanced, and whether it is trade, technological differentials or other factos that explains the non-demand part of the drop in manufacturing remains an open question, widely debated in policy- and academic circles alike.
Surprise. Anger. Fear. Bitterness. And a desperate need for explanations.
The victory of Donald Trump sent most of us on an emotional rollercoaster.
After the shock, the desire to leave and let this country solve its mess itself grew strong for many non-resident aliens like me concerned with Donald Trump’s policies. However, as many of us eventually figured out, that can’t be a solution. The U.S.A. is, after all, too big to fail. As the world’s largest economy, and a military superpower, it affects all of us. Moreover, rising nationalism is a global phenomenon that requires an understanding the U.S. case could provide. And given how unexpected the outcome of this election was – as was the Brexit vote –, understanding couldn’t be emphasized more.
Hillary Clinton essentially lost in the following States: Florida, Iowa, Michigan, North Carolina, Ohio, Pennsylvania, and Wisconsin. These States voted Obama in the previous election. Most of them were predicted by major pollsters to go democrat. Yet enough of their constituents decided to vote in a way that triggered Clinton’s defeat. There has been discussions about the role of the FBI revelations or the structure of the Electoral College, but the point here is that Clinton had no buffer against this outcome. Her “blue wall” fell even though the magnitude of the polling errors stayed within historical standards. How did that happened?
As an economist, one explanation for this result stood out for me, that I feel hasn’t received enough attention.1 The States mentioned above, Florida excepted, share a common property that Trump successfully exploited. They all are States where the manufacturing sector employs a large share of the workforce – most of them are part of the so-called Rust belt. A sector likely to employ white non-college graduates, who were the electors ending up weighting the most for Trump. But also a sector heavily affected by the opening of trade. And exit polls showed that voters concerned with “trade taking away jobs” largely supported Trump, who had promised stiff tariff increases.2 Some of these voters voted Trump for the right reason: as will be argued below, recent research suggest that the increasing trade of the U.S. – with China in particular – is indeed responsible for a large share of the losses in U.S. manufacturing jobs. Clinton clearly failed to offer a strong solution to this problem, as opposed to Trump’s muscular anti-globalization policies. Since these voters – and all those who feared a similar outcome – likely made the difference, it is only a small step further to claim that this might have costed her the election.
Below I will highlight some facts suggesting that this story feels right. Trump managed to address the concerns of these workers. And his political program may even successfully return their jobs.
But a clear conclusion can already be drawn at this point: identifying key group of voters and addressing their concerns should be a priority to avoid further surprises and prepare politicians offering serious alternatives to real problems. That doesn’t mean building an entire agenda around them, but it means identifying their concerns, and making sure they are understood and addressed, even at the cost of some concessions.
U.S. Manufacturing and the election
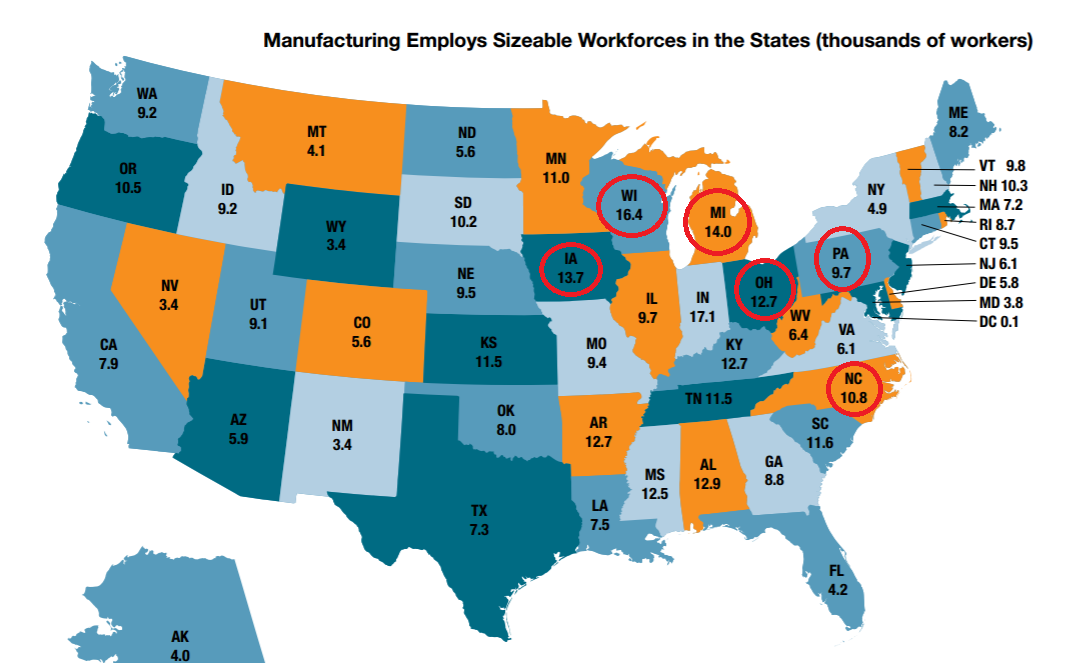
2016 data. Source: National Association of Manufacturers. Colors are only there to increase visibility.
The map above shows that the six States in question – Iowa, Michigan, North Carolina, Ohio, Pennsylvania, and Wisconsin – all share a common aspect: they employ large shares of manufacturing workers. The next important fact is to realize that an important chunk of U.S. manufacturing jobs got scrapped off during the last two decades: about 6 million between 1995 and 2007, and even more after the crisis. Our six States were all negatively affected, although heterogeneously: if Iowa lost only about 10% of its manufacturing workforce during that period, North Carolina lost a whipping 45%, while Ohio, Michigan, and Pennsylvania lost about 35%.
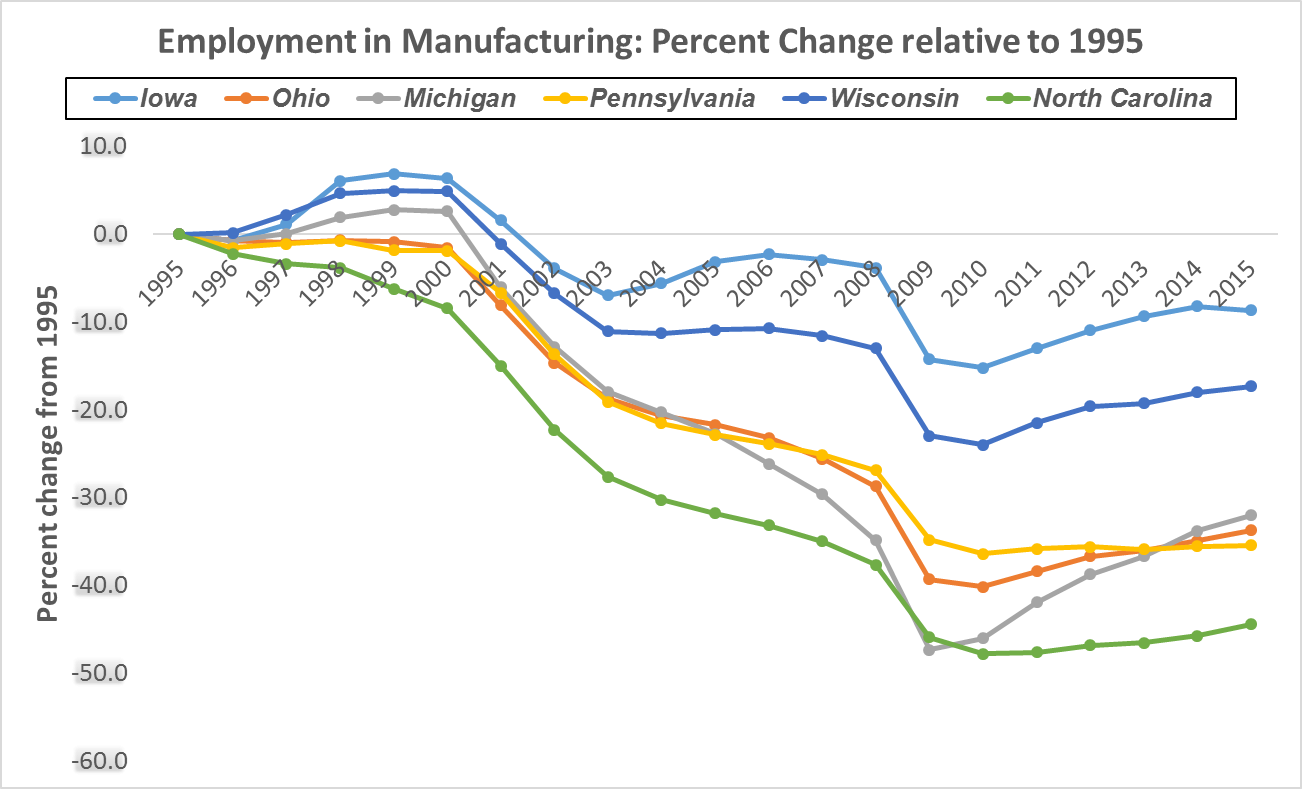
Source: Bureau of Labour Statistics.
These workers clearly weighed on the election outcome3. Exit polls show that those who thought that the “Effect of trade with other countries on U.S. jobs” is to “Take away jobs” voted 65% for Trump, against 31% for Clinton. In fact, it turns out that for workers in the manufacturing sector, this assertion seems largely true. Back-of-the-envelope calculation suggests that a bit less than 50% of U.S. manufacturing jobs were lost due to changing trade patterns.4
The policies suggested by Donald Trump strongly appealed to these workers: he took a sharp anti-globalization stand, claiming he would re-introduce tariff barriers to trade. His suggestion of a 45% increase in tariff on foreign goods5 could bring back manufacturing jobs, although the magnitude of this effect is still an open debate.6 Of course, the U.S. population “as a whole”, or rather on average, would lose from such policy, and alternatives policies such as proper social safety nets for these workers or, more eccentric perhaps, facilizing trade in services, could make every one better off. But the point is that he addressed these workers’ concerns with strength, with a policy likely to have the desired effect – as opposed to some of his populistic proposals.
On the other hand, Clinton simply did not market enough aspects of her program designed to address these concerns. She didn’t manage to spell out a clear plan to do so, one with a number or an attribute – think of the 45% increase in tariffs – that would stick in people’s mind. Blaming immigrants probably helped Trump too, but it turns out that regions with more immigrants tended to vote against rather than for him, propelling Jed Kolko, chief economist at FiveThirtyEight, to blame economic anxiety as the true underlying reason of the anti-immigrant vote.7
The most important message of this whole analysis is that one needs to consider and understand the worries of the voters likely to tip the election. Realizing which factors capture these worries and tracking them could give a useful complement to polls. Probably, research exists already that goes into that direction. Spreading it out to avoid other surprises after the Brexit and Trump’s election seems like an urgent effort considering the upcoming elections in France and Germany.
1 For an example of an article drawing these links, see https://www.washingtonpost.com/news/wonk/wp/2016/11/09/how-trump-won-the-revenge-of-working-class-whites/
2 http://www.nytimes.com/interactive/2016/11/08/us/politics/election-exit-polls.html
3 It is important to realize that the margins by which Trump won were slim. He just had the “right” constellation of states, and the magic of the Electoral College system did the rest. Even the “error” that pollsters made was not large by historical standards. The important point, and the reason why everybody got it so wrong, is that these errors were heavily correlated. This article by Nate Silver, statistician, makes that point in detail. http://fivethirtyeight.com/features/why-fivethirtyeight-gave-trump-a-better-chance-than-almost-anyone-else/
4 To find this number, I proceed with the following counterfactual: what would US manufacturing employment be if demands remained constant, but trade shares were held fix at their 1995 levels? I then re-compute the path and find that the decrease would be close to 2.5 millions, instead of 5.5-6. For a detailed argument see Koby and Trottner “Trade and Structural Transformation” (Working Paper, 2016). This magnitude seems in line with other streams of research – see Acemoglu et al. “Import Competition and the Great US Employment Sag of the 2000s” (JPE, 2016); and Caliendo et al. “Trade and Labor Market Dynamics” (Working Paper, 2015).
5 http://www.cnbc.com/2016/09/29/us-presidential-election-news-trumps-tariff-plan-for-chinese-goods-will-hurt-us-consumers.html
6 Koby and Trottner “Trade and Structural Transformation” (Working Paper, 2016).
7 http://fivethirtyeight.com/features/trump-was-stronger-where-the-economy-is-weaker/
2016 data. Source: National Association of Manufacturers.
Source: Bureau of Labour Statistics.

Laisser un commentaire
Soyez le premier à laisser un commentaire